The General Electric GE Matrix Model is a strategic business planning tool that assists companies in making informed decisions. This model, developed by the General Electric Company and McKinsey consultants, provides an analytical approach to portfolio management, helping businesses prioritize their product lineup in terms of market attractiveness and business unit strength.
Contents
Basics of the GE Matrix Model
Established by General Electric, the GE Matrix Model is an analytical tool used by businesses to categorize and prioritize their portfolio of products or services. This nine-box matrix is constructed using two primary dimensions:
- Market Attractiveness: This axis scrutinizes the appeal of a product’s given market. It examines aspects such as market growth rate, market size, and pricing trends.
- Business Strength: On this axis, businesses assess their ability to compete effectively. They review factors like brand strength, production capacity, and market share.
By plotting their products or business units inside the nine boxes, businesses can identify the strategic steps they should take – invest, hold, or divest.
Three Main Reasons Why the GE Matrix Important?
- Informed Decision-making: The matrix helps businesses make informed strategic decisions. By understanding their offerings in relation to market attractiveness and business strength, decisions concerning investments and resource allocation become clearer.
- Tailored Strategies: Each business unit or product can have unique strategies. Based on where they land on the matrix, managers can create customized strategies to either capitalize on growth opportunities or manage potential risks.
- Structured Analysis: It streamlines the process of evaluating commercial activity by boxing everything into a structured, visual analysis. This can be particularly useful if there are many different business units or products to consider.
How to construct the GE Matrix
Follow the steps below, or grab the Free GE Matrix Excel Template. And please see instructional video at the end of this post.
Step 1 = Identify Your Business Units:
Kick off by listing your company’s strategic business units (SBUs). These can be products, services or divisions that have their own strategies and competitors. Let’s say, for instance, you manage a sports equipment company. Your SBUs could include footballs, basketballs, and tennis rackets, among others.
Step 2 = Measure Market Attractiveness:
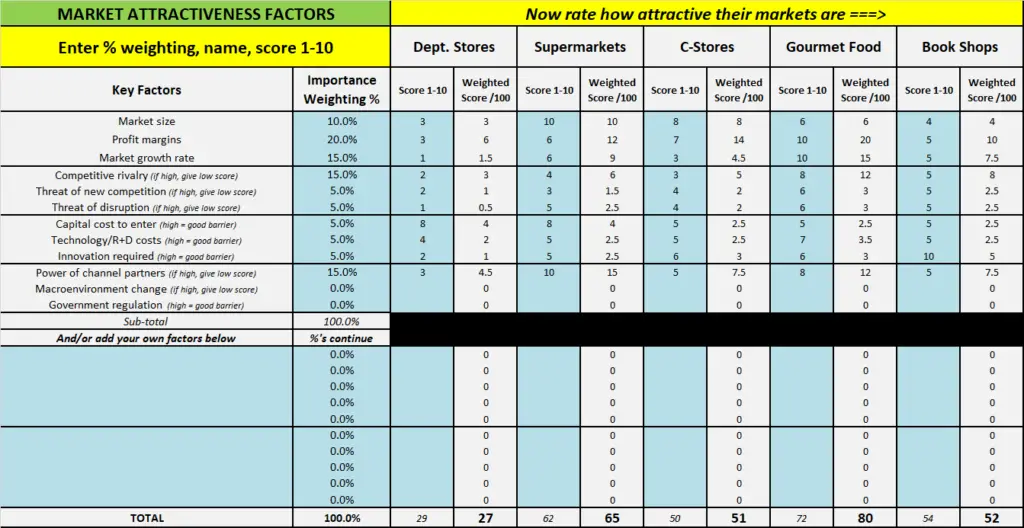
The vertical axis in your GE Matrix is all about ‘Market Attractiveness’. This could include market factors such as size of market, market growth rates, market profitability, pricing trends, distribution structures, or technological developments, to name a few. Develop a scoring method, with 1 being the least attractive and 10 the most attractive.
Here are some ideas for Market Attractiveness factors.
Step 3 = Assess Business Strength:
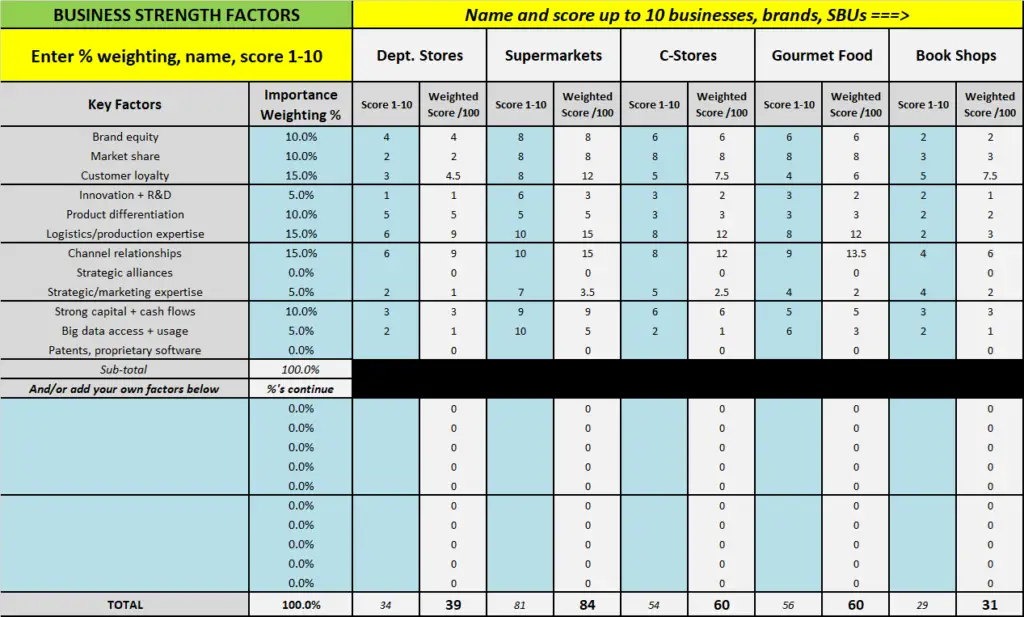
Similarly, you’ll need to evaluate each business unit for its competitive strength. The horizontal axis, ‘Business Strength’, covers factors such as market share, strength of assets and competencies, brand strength, customer loyalty, and cost advantages. Again, rank each SBU from 1 (weakest) to 10 (strongest).
Here are some ideas for Business Strength factors.
Step 4 = Plot:
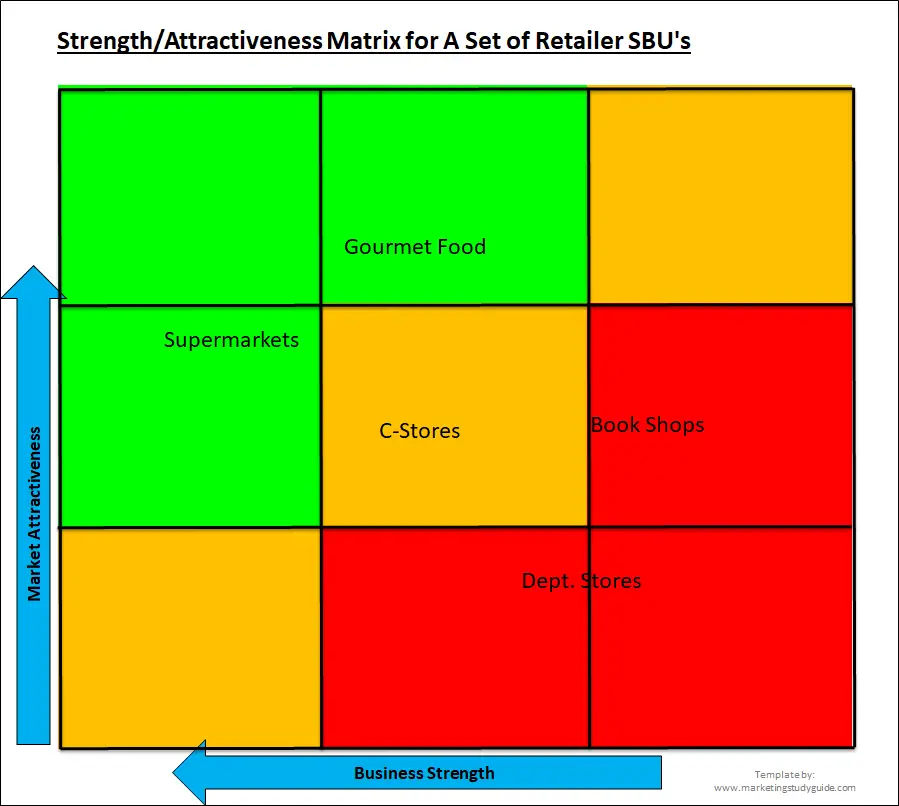
Now, with each SBU scored for market attractiveness and business strength, it’s time to plot these scores on our GE Matrix, as per below.
Factors To Consider When Constructing a GE Matrix
What are the key factors one must consider when constructing a GE Matrix?
Choose appropriate factors:
The choice of factors for market attractiveness and business strength should be relevant to your organization and industry. Generic factors may not capture the complexity of your business environment.
Weight the Factors:
No two factors typically carry the same importance. Thus, you need to assign weights to them. These must add up to 1. For instance, if you deem market size has twice the importance compared to the growth rate, assign a weight of 0.6 to market size and 0.3 to growth rate.
Consistent Scoring:
Ensure consistency in the scoring to maintain accuracy. Ensure the same criteria and parameters are used for each SBU.
Examples of using the GE Matrix Model
Starbucks Coffee Company
Starbucks, the widely recognized coffeehouse chain, makes an excellent case study for the GE Matrix Model. With a range of products that vary in both market attractiveness and business strength, plotting them on a GE Matrix gives us a comprehensive understanding of their portfolio.
- High Market Attractiveness/High Business Strength: Starbucks’ most popular beverage, the Frappuccino, falls neatly into this quadrant. With high consumer demand and Starbucks’ strong push in marketing and distribution, this product shows the company’s strong footing in this category.
- High Market Attractiveness/Low Business Strength: Starbucks also came out with its carbonated drinks, dubbed “Spiced Root Beer,” “Golden Ginger Ale,” and “Lemon Ale.” While this market is attractive regarding consumer interest and potential revenue, Starbucks competes with long-standing, popular brands, placing it at a disadvantage.
- Low Market Attractiveness/High Business Strength: The Starbucks Decaf Pike Place Roast can be considered less attractive in the overall market due to lower demand for decaffeinated coffee. However, Starbucks, with its robust supply chain and distribution network, is capable of effectively marketing this product.
General Electric (GE)
Since the GE Matrix is developed by none other than General Electric, it would be remiss not to discuss how this corporation uses this model.
- High Market Attractiveness/High Business Strength: GE’s Healthcare division, specializing in medical imaging and diagnostics equipment, falls into this quadrant. With the constant demand for innovative healthcare solutions and GE’s market dominance, this particular division has high market attractiveness with constant demand and GE rules the roost with its innovative solutions.
- High Market Attractiveness/Low Business Strength: The Lighting Solutions division of GE is part of a crowded market, with numerous competitors offering similar products. Despite the high potential of the market, GE’s strength in this field is comparatively lower.
- Low Market Attractiveness/High Business Strength: GE’s Capital aviation services division falls into this quadrant due significant competition and the cyclical nature of the sector. Despite these challenges, GE’s considerable resources and brand strength keep them competitive in the sector.
Limitations and Criticisms of the GE Matrix Model
Subjective Analysis
Keep in mind that the GE Matrix model inherently involves some degree of subjectivity. The assignment of ratings and weightages to the factors in business strength and market attractiveness is largely dependent on human judgment. It’s subjective and could potentially lead to bias.
Two different teams might come up with different GE Matrices for the same company or business unit due to variations in their perceptions of market variables and competitive advantages.
Complexity Issues
The GE Matrix Model requires a good deal of information and data, not to mention the task of gathering, analyzing and interpreting this information which can be time-consuming and complex.
Small businesses and startups may find it challenging to access such comprehensive data or lack the manpower to conduct in-depth market analysis.
Fluctuating Market Conditions
The model also assumes relatively stable market conditions, which may not always be the case. Sudden changes in the market, arising from unforeseen events or shifts in consumer behavior, can drastically alter the validity of the GE Matrix analysis.
High Resource Commitment
The implementation of strategies based on the GE Matrix often involves a high commitment of resources. It means that a wrong assessment can lead to significant losses. For example, investing heavily in a business unit perceived to have high market potential and strong competitiveness, only to find the projections were overly optimistic.
Categorization Challenges
The rather rigid categorization into three cell classifications may sometimes be misleading. A product with a score that barely squeezes into the high attractiveness, strong business unit box can be incorrectly given similar strategic prominence as a product with much higher scores.
Focus on Current Business
The GE Matrix Model primarily emphasizes the current businesses of a firm. It might overlook the potential of new ventures or diversifications that might prove beneficial in the long-term, narrows the company’s vision and hinders long-term growth.
Comparison to the BCG Matrix
The GE Nine Box Matrix and the BCG Matrix are both popular tools used in business for portfolio analysis and strategic management. However, they have distinct features and approaches. Here’s a comparison and contrast of these two models:
Similarities:
- Portfolio Analysis: Both are used for analyzing a company’s portfolio of businesses or products.
- Strategic Decision-Making: They aid in making strategic decisions regarding investment, development, or divestment.
- Matrix Format: Each employs a matrix format for visual representation and analysis.
- Market Consideration: Both models consider market factors to assess business units or products.
Differences:
- Dimensions of Analysis:
- GE Nine Box Matrix: It uses two dimensions – ‘industry attractiveness’ and ‘business unit strength.’ Each of these dimensions has three levels: high, medium, and low.
- BCG Matrix: This matrix uses ‘market growth rate’ and ‘relative market share’ as its dimensions. The categories are high or low, resulting in four quadrants.
- Complexity and Nuance:
- GE Nine Box Matrix: It is generally considered more complex and nuanced due to its three-tier categorization in each dimension.
- BCG Matrix: It is simpler, with a two-tier categorization, making it more straightforward but potentially less nuanced.
- Strategic Implications:
- GE Nine Box Matrix: Offers a more granular strategy approach, with nine potential categories each requiring a different strategy.
- BCG Matrix: Provides a more high-level view, categorizing businesses into four types (Cash Cows, Stars, Question Marks, Dogs), each with a recommended general strategy.
- Scope of Application:
- GE Nine Box Matrix: Due to its complexity, it is often used by larger, more diverse companies with varied business units.
- BCG Matrix: Its simplicity makes it more accessible for smaller companies or those with less diversity in their product lines.
- Subjectivity in Assessment:
- GE Nine Box Matrix: Can be more subjective due to more criteria needing judgment in assessing industry attractiveness and business unit strength.
- BCG Matrix: Relies on more concrete data (market share and growth rate), though these can still be subject to interpretation.
- Focus on Industry Dynamics:
- GE Nine Box Matrix: Puts more emphasis on the attractiveness of the industry, considering external market conditions.
- BCG Matrix: Focuses primarily on the product’s position in the market, with less emphasis on the broader industry dynamics.
In summary, while both models serve similar purposes in strategic planning and portfolio management, the GE Nine Box Matrix offers a more detailed and complex analysis, whereas the BCG Matrix provides a simpler, more straightforward approach. The choice between these models often depends on the specific needs of the business, the complexity of its portfolio, and the preference for detail in strategic analysis.
VIDEO: Using the Free GE Matrix Template
FAQs
What is the GE Nine Box Matrix?
The GE Nine Box Matrix is a strategic business tool developed by McKinsey & Company for General Electric. It helps businesses prioritize their investments among various business units.
How is the matrix structured?
The matrix is a 3×3 grid. The horizontal axis represents industry attractiveness (low, medium, high), and the vertical axis represents business unit strength (low, medium, high).
What does each axis represent?
- Industry Attractiveness: Factors like market growth, profitability, and competitive intensity.
- Business Unit Strength: Factors like market share, brand strength, and product quality.
How is the matrix used in strategic planning?
It assists in evaluating the potential of different business units or product lines, guiding decisions on resource allocation and strategy based on two key dimensions: market attractiveness and competitive strength.
What are the strategic implications of different positions in the matrix?
- High Attractiveness, High Strength: Invest and grow.
- High Attractiveness, Low Strength: Selective investment.
- Low Attractiveness, High Strength: Harvest or divest.
- Low Attractiveness, Low Strength: Divest.
Can the GE Nine Box Matrix be applied to all types of businesses?
Yes, it’s versatile and can be adapted to different industries and business sizes, but its effectiveness can vary depending on the complexity and nature of the business.
What are the benefits of using the GE Nine Box Matrix?
It provides a structured approach for portfolio analysis, helps in resource allocation decisions, and encourages a broader perspective on business units.
Are there any limitations to the matrix?
Yes, it can be subjective, as the rating of attractiveness and strength may vary based on personal judgment. It also doesn’t account for synergies between business units or external factors like economic changes.
How does the GE Nine Box Matrix differ from the BCG Matrix?
While both are portfolio analysis tools, the GE Matrix offers a more nuanced approach with three categories instead of the BCG Matrix’s two. It also considers industry attractiveness, unlike the BCG Matrix, which focuses on market growth rate.
How often should a business revisit its GE Nine Box Matrix analysis?
Regularly, especially when there are significant changes in the market or within the business units. Typically, an annual review is recommended, but this may vary depending on the industry dynamics.


