Contents
GE-McKinsey Matrix Excel Template
The GE matrix is now officially known as the GE-McKinsey nine-box matrix (please scroll down for the strategic guidance for each box in the matrix).
According to the McKinsey website, the framework “offers a systematic approach for the multibusiness corporation to prioritize its investments among its business units.
It was developed in the 1970s, after the development of the Boston Consulting Group (BCG) matrix. The GE-McKinsey multi-business matrix, however, is a far superior tool as compared to the BCG matrix, because it builds in multiple factors and scores them on a set criteria. Whereas, the BCG matrix uses two top-level measures to approximate business strengthen industry attractiveness.
Free download of the Excel template for making the GE-McKinsey matrix
A Excel template has been developed by the Marketing Study Guide so that you can build and present the GE-McKinsey matrix quickly and effectively.
Please click here to download the free Excel template…
Scroll to the bottom of this post for more information and what each of the nine boxes tell us…
Video instructions on how to use the GE matrix template maker
How the GE-McKinsey Excel template presents
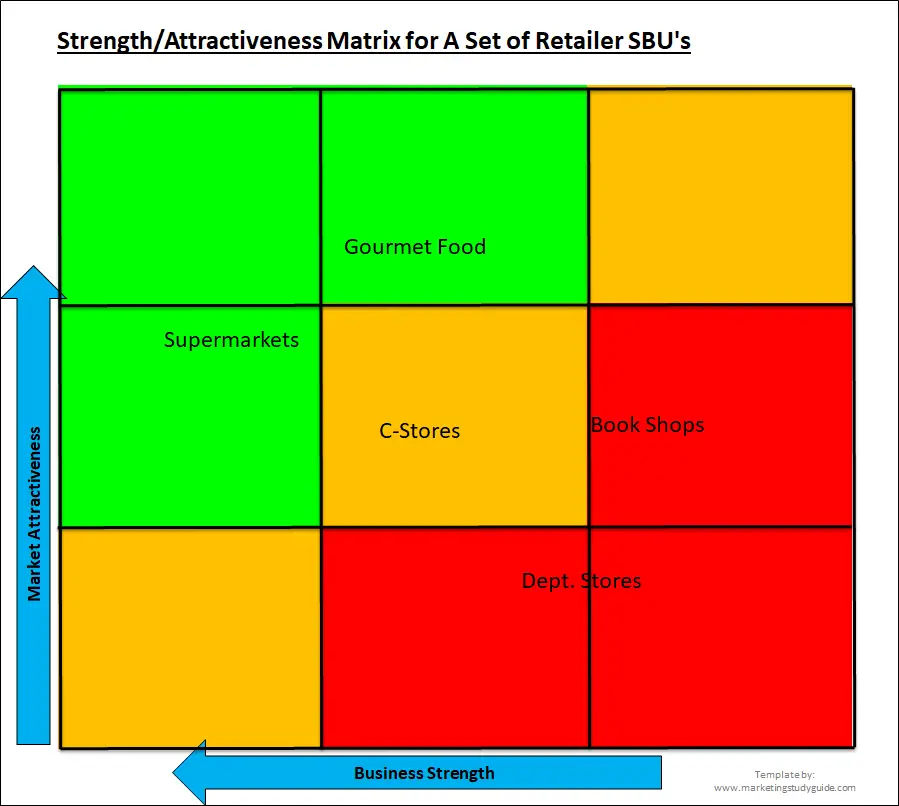
Here is an example of the final GE matrix that would be produced using the free Excel template (available for free download above).
How the multi-factor Excel template works
As you can see above, the end result is plotting firms, brands, or strategic business units (SBU’s) onto a two-dimensional matrix. This matrix shows overall industry attractiveness relative to the firm/SBU, against the overall business strength of that firm/SBU.
The results are plotted on a nine box matrix. The green color boxes indicate a good match of strength and industry attractiveness – and therefore, the business should invest in this area.
The yellow/gold cells running diagonally indicate a reasonable business opportunity that the corporation should either hold or selectively look to improve, but without the full on investment suggested by the green cells.
The red cells are a poor match of both industry attractiveness and relative business strength and the firm is playing the wrong markets here and should look to divest and use the money more effectively somewhere else, such as in the green cells area.
Here are the steps to complete the multi-factor GE-McKinsey matrix Excel template:
Rate the market attractiveness factors – as shown below:
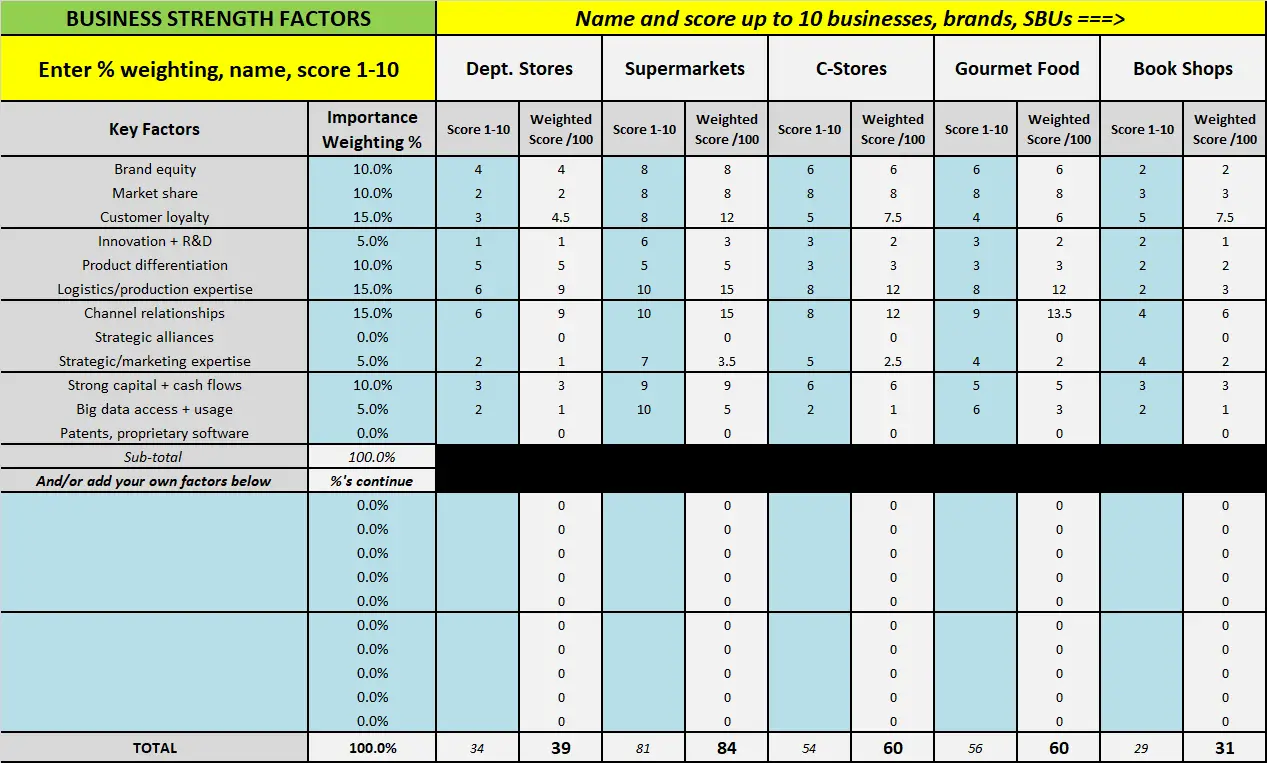
As you can see, you first need to list your firm/SBUs across the top – in this example, generic types of retailing chains have been used. Then you need to allocate a percentage importance rating to each of the key factors that you want to include in your design of the matrix.
If you do not want to include a particular factor, then leave the importance rating at 0%. And if you want to add your own business strength factors into the multi-factor model, you can add your own at the bottom.
You then need to score, on a 1 to 10 basis, each of the firms/SBUs that you wish to include. You can score up to 10 firms using the free template. The importance ratings remain the same for each business, to ensure a consistent and relative outcome on the matrix.
Next Step: Rate the market attractiveness factors – as shown below:
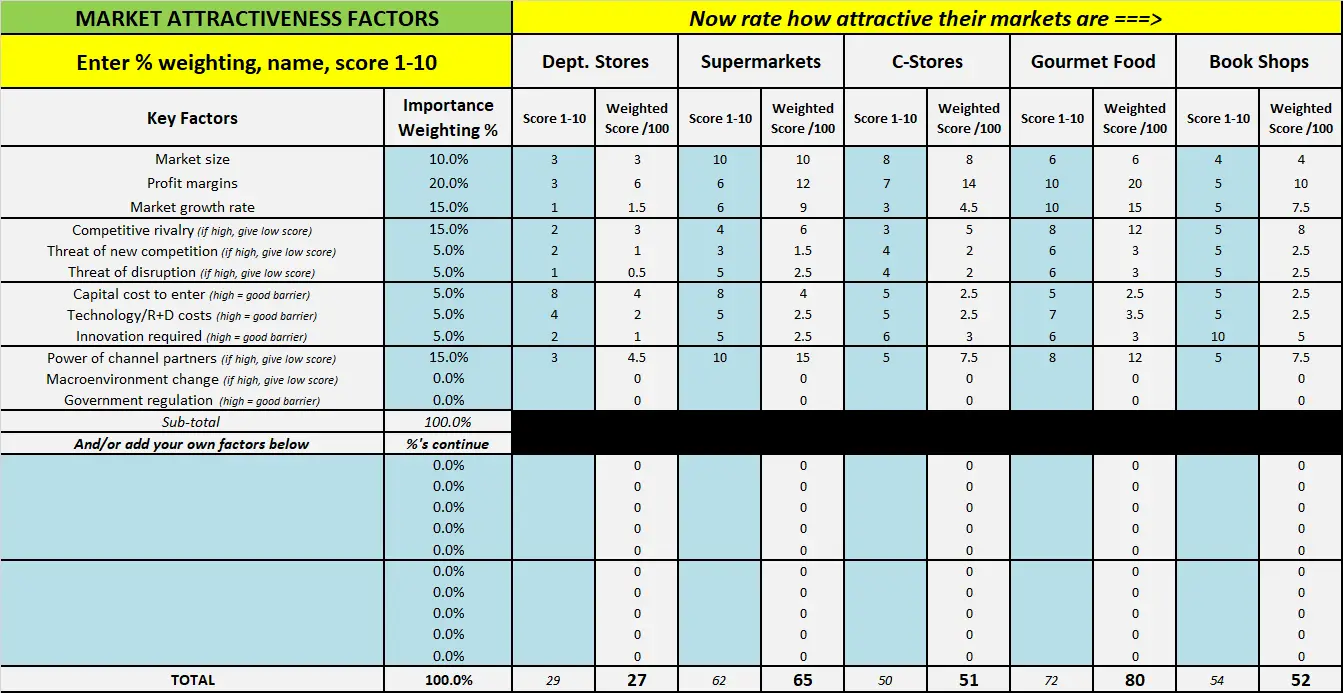
Next we scroll down the Excel worksheet and directly underneath you will need to score the firms/SBUs on market attractiveness. Again, you construct your own GE-McKinsey matrix by selecting the percentage importance weighting of each factor that you wish to include. So the process is identical to the prior step.
HOWEVER, there are some market attractiveness factors that are negative – these have been indicated in the list of key factors. For example, competitive rivalry is not good – so if competitive rivalry is high, then you should give it a low score in the template, as this makes the market relative unattractive.
Final Step: Review and copy and paste your automatically generated GE-McKinsey nine box matrix
Once you have completed the above two steps, then the McKinsey matrix is produced automatically underneath the input tables. You can then copy and paste the matrix into your report or presentation.
What Do Each of the Nine Boxes on the GE-McKinsey Tell Us?
Here’s an overview of the nine cells in the GE-McKinsey Nine-Box Matrix:
1. High Attractiveness, Strong Competitive Position (Upper-Left Cell):
This cell represents business units with high industry attractiveness and a strong competitive position. These units are considered highly attractive and well-positioned in the market. They have significant growth potential and offer opportunities for further investment and expansion.
2. Medium Attractiveness, Strong Competitive Position (Upper-Middle Cell):
Business units in this cell have medium industry attractiveness but a strong competitive position. Although the industry may not be as attractive as the ones in the upper-left cell, these units have a competitive advantage and can generate stable profits. Companies should consider selectively investing in these units and maintaining their strong position.
3. Low Attractiveness, Strong Competitive Position (Upper-Right Cell):
This cell includes business units with low industry attractiveness but a strong competitive position. These units may operate in declining or low-growth markets, but they possess a competitive advantage over rivals. Companies can choose to harvest profits from these units, optimize operations, or consider divestment if the market conditions deteriorate further.
4. High Attractiveness, Medium Competitive Position (Middle-Left Cell):
Business units in this cell operate in highly attractive markets but have a relatively weaker competitive position. While the market offers growth opportunities, these units face strong competition. Companies should focus on improving their competitive position or selectively investing to capitalize on the market attractiveness.
5. Medium Attractiveness, Medium Competitive Position (Middle-Middle Cell):
This cell represents business units with moderate industry attractiveness and a moderate competitive position. These units have stable market conditions and a satisfactory competitive position. Companies should carefully evaluate these units and allocate resources accordingly.
6. Low Attractiveness, Medium Competitive Position (Middle-Right Cell):
Units in this cell face both low industry attractiveness and a moderate competitive position. They operate in markets with limited growth potential and have average competitive strength. Companies should carefully manage these units, optimize operations, and consider divestment if the market conditions worsen.
7. High Attractiveness, Weak Competitive Position (Lower-Left Cell):
This cell includes business units operating in highly attractive markets but with a weak competitive position. These units have significant growth potential, but their competitive weaknesses can hinder success. Companies should invest in improving their competitive position or form strategic alliances to leverage the market attractiveness.
8. Medium Attractiveness, Weak Competitive Position (Lower-Middle Cell):
Units in this cell have moderate industry attractiveness but a weak competitive position. These units face challenges in terms of competition and market dynamics. Companies should carefully evaluate the potential for improvement and consider selective investments or strategic partnerships.
9. Low Attractiveness, Weak Competitive Position (Lower-Right Cell):
Business units in this cell operate in unattractive markets and have a weak competitive position. These units face significant challenges and offer limited growth potential. Companies should consider divestment or exit strategies for these units.
Related information


