Contents
The ATAR Forecasting Model Formula
The ATAR forecasting model is generally used to help marketers forecast sales volumes, sales revenue and profit contribution – primarily for new products, but it can essentially be used for any marketing campaign or project.
The letters in the ATAR model stand for
- A = Awareness
- T = Trial
- A = Availability
- R = Rebuy or Repeat
Get the free ATAR forecasting model: Free Download: ATAR Model Excel Template
Expressed in percentages or decimals
These four main components of the ATAR model are presented in a percentage (or decimal) form.
For example, awareness of 60% of the new product, potentially trialed by 20% of consumers, 75% availability within stores, with 50% of consumers (trialing product at least once) and then continuing to rebuy/repurchase the product on a regular or occasional basis.
Multiplied together to determine size of ongoing customer base
The four components of the ATAR are multiplied together to generate the end percentage of target market consumers that will become the new product’s ongoing customer base.
Essentially, the size of the customer base is what the ATAR components should estimate, and along with the other data – see section below – profitability, sales units, sales revenue, and so on can be determined.
Using the example percentages above, if we started with a target market size of 10 million consumers, then ongoing customer base (in consumers, not sales) would be calculated as:
- 10 million consumers (in the target market = buying units)
- X 60% awareness
- X 20% trial
- X 75% availability
- X 50% repeat/rebuy
By multiply each of these ATAR components, this would work out to be:
- Start with 10,000,000 consumers
- 6 million consumers aware of the new product(10m X 60%)
- 1.2 million consumers willing to trial the products (6m X 20%)
- 900,000 consumers finding the product “available” in a store and trailing the product (1.2 m X 75%)
- And finally 450,000 ongoing customers (from light to heavy users) (900,000 X 50%)
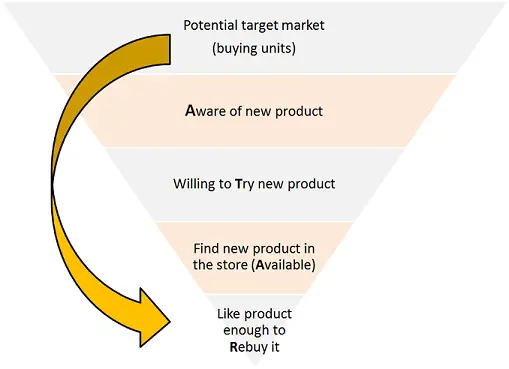
As you can see, the ATAR forecasting model essentially breaks down the overall target market progressively, using the four inputs of awareness – trial – availability – repeat/rebuy – to estimate the size of the ongoing customer base.
For example: If we multiply the four ATAR components above, we would get 60% X 20% X 75% 50% = 4.5%.
This tells us that we expect to have 4.5% of the total target market (number of buying units) becoming our ongoing customer base, as shown in the above example (where 4.5% of the 10 million consumers = 450,000 customers).
This concept is illustrated in the above diagram.
Based on marketing assumptions
The reason that the ATAR formula and its components are attractive to marketers is because it produces a relatively robust financial projection that is primarily based on marketing inputs.
This then allows the marketing team to construct a launch program designed to meet these marketing goals. It also allows for beautification key marketing targets and a marketing “control contingency” plan to be put into place prior to the new product launch.
ATAR forecast requires several years of assumptions
The ATAR approach to new product forecasting, like most approaches to forecasting, requires a forecast over several years (usually 2 to 5 years)– depending on the type of product, the firm and the industry involved.
Obviously, at times, management would like to see forecasts further into the future, but sales and profit forecasts generally become more unreliable after a 5 year horizon due to the dynamic nature of markets, shifting consumer needs, new technology development and innovation, as well as competitive actions.
As you will see when you’re using the free Excel template for the ATAR forecast, you will need to enter your financial assumptions from year 0 to year 5.
Further data inputs required to complete the ATAR forecast
While these four letters (ATAR) these are the core assumptions and inputs into the sales forecasting model, the
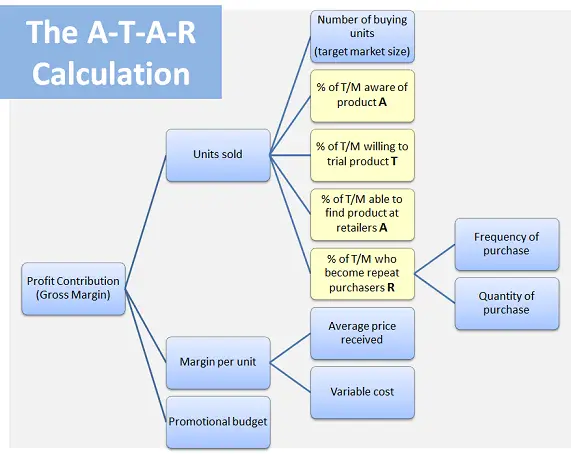
ATAR model requires further inputs to calculate the sales and profit projections.
The additional information required is:
- The number of consumers/buying units in the marketplace
- The loyalty rate of your customer base over time
- The average purchase quality per buying unit/consumer
- The average price and cost per unit – to determine margin per unit
- Expected promotional spend/budget
- Likely product cannibalization rate, if applicable
What is the ATAR forecast model?
The ATAR forecast model is a marketing model that stands for Awareness, Trial, Availability, and Repeat. It is a framework used to forecast and analyze the potential success of a new product or service in the market.
Here’s a breakdown of each component:
1. Awareness: This refers to the level of consumer knowledge or recognition of a particular product or brand. It measures the extent to which the target market is aware of the product’s existence and its features.
2. Trial: Trial represents the initial purchase or usage of the product by consumers. It focuses on encouraging potential customers to try the product for the first time, often through promotional activities, free samples, or trial offers.
3. Availability: Availability refers to the accessibility and distribution of the product. It considers factors such as the product’s physical availability in stores or online, the ease of purchasing or obtaining it, and the overall convenience for customers.
4. Repeat: Repeat refers to the likelihood of customers repurchasing the product or becoming loyal to the brand. It measures the rate at which customers continue to buy the product after the initial trial, indicating their satisfaction and loyalty.
Find Out More About ATAR Forecasts
- Most ATAR factors are interrelated
- Benefits of the ATAR forecast model
- Limitations of ATAR forecasting
- Availability in ATAR Forecasts
- Trial in the ATAR Forecast
- Awareness in the ATAR Model
- Rebuy/repeat in the ATAR forecast model
- ATAR Examples for Two Small Businesses
- How the ATAR Forecasting Model Works
- ATAR Model: Guide to Prices, Costs, Margins, Quantity
- ATAR Formula
- Buying Units in the ATAR Forecast Model


