Contents
ATAR Model Forecast Examples
In these ATAR forecast examples, we will consider two small businesses.
First example
For this example, there is a coffee shop in a local area. Their new product is a service – they plan to renovate their store and add a small bookshop area.
This area will co-exist within their coffee store. Their plan is to generate book sales, in addition to their current coffee/cake sales.
Here are their ATAR assumptions:
- Local population = 100,000 people
- Awareness = 80% (using a $50,000 local promotion, plus their store in in the main street)
- Trial = 10% (as they only expect a small % of the customers to also be interested in buying a book)
- Availability = 100% (as they run and control the store)
- Repeat = 50% (just an estimate – they aren’t sure about this one)
- Loyalty = 80% (current loyalty of their coffee store)
- Upfront cost = $250,000 (to redesign the store)
- Book sales = 4 per year
- Average book price = $25
- Average book cost = $15
- Promotional support = $50,000 in year 1, then $10,000 pa ongoing
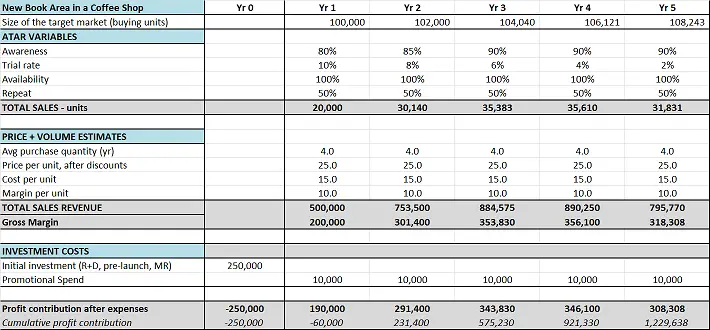
Their ATAR Financial Forecast is Looking Good…
Note: The above image and forecast is from the free ATAR forecasting tool – grab the free tool: Free Download: ATAR Model Excel Template
Their Key ATAR Results
- Break-even (pay-back) in year 2
- Sales units pa = 35,000 (100 books per day – they are open 7 days)
- Additional profit contribution of $190,000 in year 1, growing to over $300,000 pa
Therefore, on this basis the proposed new product/service looks financially viable.
Second Example ATAR Forecast Example
Assume a company is launching a new energy drink and they want to forecast its potential success using the ATAR model.
Awareness:
The company conducts market research and determines that based on their promotional activities, advertising campaigns, and word-of-mouth efforts, they expect the product’s awareness to reach 30% of the target market, which consists of 1 million potential consumers.
- Awareness = 30% = 0.3
- Target market size = 1,000,000
- Estimated awareness = 0.3 * 1,000,000 = 300,000
Trial:
The company plans to distribute free samples at various events and locations to encourage consumers to try the product. They estimate a trial rate of 20% based on their research and industry benchmarks.
- Trial rate = 20% = 0.2
- Estimated trials = 0.2 * 300,000 = 60,000
Availability:
The company aims to make the product readily available in convenience stores, supermarkets, and online platforms. They anticipate achieving a distribution rate of 80%.
- Distribution rate = 80% = 0.8
- Estimated availability = 0.8 * 60,000 = 48,000
Repeat:
The company expects a repeat purchase rate of 30% among those who have tried the product, indicating that 30% of customers will continue to purchase.
- Repeat purchase rate = 30% = 0.3
- Estimated repeat purchases = 0.3 * 60,000 = 18,000
Assuming:
- Priced at $2.00 per unit
- With the production cost per unit is estimated to be $1.20
- Estimated repeat purchases: 18,000 customers (as per above)
- Frequency of purchase: 3 times per month
We can then calculate the profit forecast using the ATAR model:
- Profit per unit = Price per unit – Cost per unit = $2.00 – $1.20 = $0.80
- Estimated total repeat purchases per month = Estimated repeat purchases * Frequency of purchase = 18,000 * 3 = 54,000 units
- Estimated total profit per month = Profit per unit * Estimated total repeat purchases per month = $0.80 * 54,000 = $43,200
Based on these calculations, the ATAR profit forecast for this product ongoing (after the initial launch period), would be approximately $43,200 per month.
Just in Case: Recap of the ATAR Forecast Model Components
The ATAR forecast model is a marketing model that stands for Awareness, Trial, Availability, and Repeat. It is designed to help forecast and analyze the potential success of a new product or service in the market.
Awareness refers to the level of consumer knowledge or recognition of a particular product or brand. It measures the extent to which the target market is aware of the product’s existence and its features.
Trial represents the initial purchase or usage of the product by consumers. It focuses on encouraging potential customers to try the product for the first time, often through promotional activities, free samples, or trial offers.
Availability refers to the accessibility and distribution of the product. It considers factors such as the product’s physical availability in stores or online, the ease of purchasing or obtaining it, and the overall convenience for customers.
Repeat refers to the likelihood of customers repurchasing the product or becoming loyal to the brand. It measures the rate at which customers continue to buy the product after the initial trial, indicating their satisfaction and loyalty.
How to Make an ATAR Forecast Model in Excel (VIDEO)
How to Use the ATAR Forecast Free Excel Tool (VIDEO)
Find Out More About ATAR Forecasts

